Cricket Win Probability Explained: How Today’s Match Prediction Is Calculated
Posted on August 15, 2026 by Admin
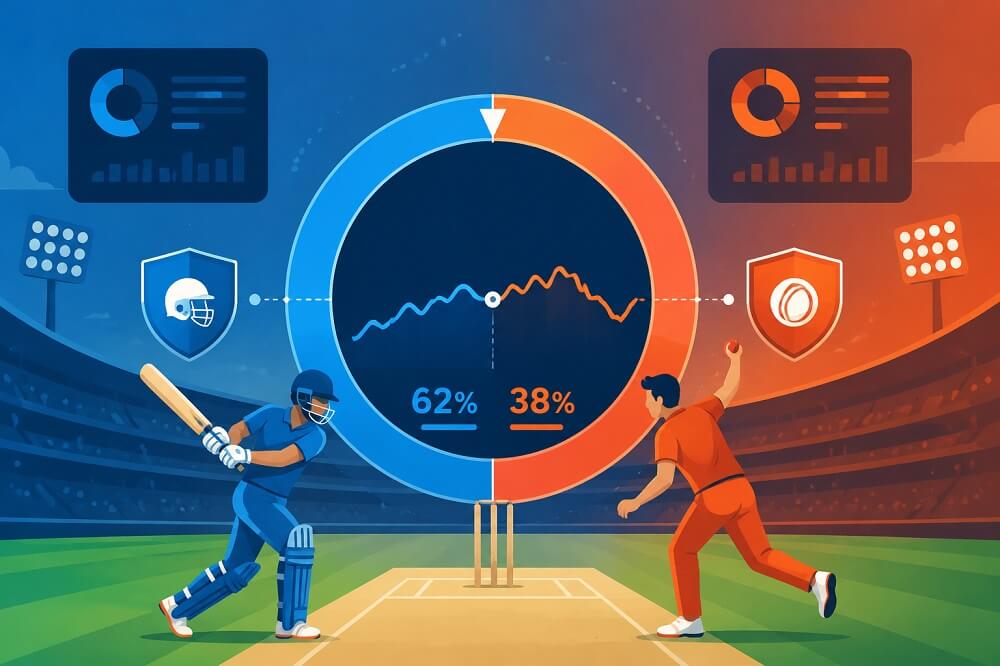
If you have watched a live cricket match, you have probably seen a graphic showing something like Team A 72% — Team B 28%. But what does that percentage actually mean?
Cricket win probability is a statistical estimate of how likely each team is to win from a particular point in the match. Unlike a simple prediction that says who is expected to win, a probability model measures the strength of both possible outcomes.
The number can change after almost every delivery. A wicket, boundary, dropped catch, change in required run rate or even a shift in match conditions can move the calculation.
Modern cricket analytics models use historical match data, current score, wickets, balls remaining, player strength, venue characteristics and other match conditions to estimate win probability. Advanced systems may simulate the remaining balls thousands of times to calculate how often each team is expected to win. For users searching Play99Exch cricket predictions and match win probability, these statistics can provide useful context when evaluating a live match.
What Is Cricket Win Probability?
Cricket win probability represents the estimated chance that a team will eventually win the match given the information available at that moment.
For example:
- Team A: 70%
- Team B: 30%
This does not mean Team A is guaranteed to win. It means that, among situations the model considers similar, Team A is estimated to win approximately 70% of the time.
That distinction is important. A team with a 75% win probability can still lose. Probability measures likelihood, not certainty.
How Is Cricket Win Probability Calculated?
There is no single universal formula used by every cricket website, broadcaster or analytics provider. Different models use different datasets, algorithms and variables.
A typical model follows several steps:
1. Collect Historical Cricket Data
The model first learns from large amounts of previous match data.
Depending on the format, this can include:
- Match results
- Team strength
- Runs scored
- Wickets lost
- Balls remaining
- Run rate
- Required run rate
- Batter performance
- Bowler performance
- Venue characteristics
- Toss and innings information
- Home advantage
- Match conditions
Research on cricket forecasting has used variables such as score or lead, overs remaining, run rate, wickets used, team strength, venue and home advantage to estimate match outcomes.
2. Understand the Current Match Situation
The model then looks at what is happening right now.
For a T20 chase, for example, it may consider:
Target: 180
Score: 105/3
Overs: 13
Runs required: 75
Balls remaining: 42
Wickets in hand: 7
This gives the model a snapshot of the match state.
The same score can have completely different meanings depending on how many balls and wickets remain.
3. Calculate the Importance of Runs and Wickets
Runs are important, but wickets are a crucial resource in limited-overs cricket.
Suppose two teams both need 60 runs from 36 balls:
- Team A has 8 wickets remaining.
- Team B has 3 wickets remaining.
The first team would normally have a much stronger position because it has more batting resources available.
Advanced models therefore don’t simply compare runs. They consider runs, balls and wickets together.
4. Consider Required Run Rate
Required run rate is one of the most visible factors during a chase.
The basic calculation is:
Required Run Rate = Runs Required ÷ Overs Remaining
For example, if a team needs 72 runs from 48 balls:
72 ÷ 8 = 9 runs per over
The model compares this requirement with expected scoring rates and the resources available to the batting team.
A required rate of 9 might be manageable in one T20 situation but extremely difficult if only two wickets remain.
5. Account for Team and Player Strength
More advanced systems go beyond basic match statistics.
They can estimate the expected performance of individual batters, bowlers and teams. For example, an elite batter facing a particular bowler may have a different expected outcome from a lower-rated batter facing the same bowler.
Opta’s cricket simulation approach, for example, incorporates batter, bowler and venue information when estimating what may happen on future deliveries.
6. Include Venue and Match Conditions
A cricket ground is not just a location; it can influence the expected scoring environment.
Models may consider:
- Average scores at the venue
- Batting conditions
- Bowling conditions
- Boundary dimensions
- Home advantage
- Dew
- Pitch characteristics
- Day/night conditions
Research has also found that venue, toss outcome and toss decision can influence ODI match outcomes, although their effects can vary by team and situation.
7. Simulate the Remaining Match
One sophisticated way to calculate live win probability is through match simulation.
The system estimates possible outcomes for future deliveries and repeatedly simulates the rest of the match.
For example, it might simulate thousands of possible futures:
- In one scenario, the batting team scores 12 runs in the next over.
- In another, it loses two wickets.
- In another, it scores a boundary from the first ball.
- In another, the bowling team controls the next five overs.
After many simulations, the model counts how often each team wins.
If Team A wins 6,800 simulations out of 10,000, the estimated probability would be approximately 68%.
Stats Perform describes a similar simulation-based approach in which the remaining balls are simulated using the current match situation, player information and venue characteristics.
Why Does Win Probability Change After Every Ball?
This is one of the most interesting parts of live cricket analytics.
Imagine a team needs 30 runs from 18 balls with 6 wickets remaining.
A boundary may increase its probability because the required target becomes smaller.
But if the next ball produces a wicket, the probability can fall sharply because the batting team has lost an important resource.
For this reason, live win probability can move rapidly:
Boundary → probability rises
Dot ball → probability may fall slightly
Wicket → probability can fall significantly
Six → probability can rise significantly
The size of the change depends on the match situation.
A wicket in the first over is usually less decisive than a wicket with two overs remaining and a difficult target still required.
Know More: Understanding upcoming fixtures can provide useful context, so readers can check the Cricket World Cup 2027 schedule and launch details for the latest tournament information.
Win Probability in T20, ODI and Test Cricket
The calculation also changes according to the format.
T20 Cricket
T20 models place significant emphasis on:
- Balls remaining
- Wickets in hand
- Required run rate
- Boundary-scoring ability
- Death-over performance
- Batter and bowler matchups
Because there are only 120 legal deliveries per innings, a single over can dramatically change the match.
ODI Cricket
ODI models have more time to account for:
- Run rate
- Wickets in hand
- Partnership stability
- Middle-over scoring
- Powerplay performance
- Death-over scoring
- Target size
The value of wickets can change significantly depending on how many overs remain.
Test Cricket
Test cricket requires a different approach because a match can end in a win, loss or draw.
Models can consider:
- Current lead
- Wickets remaining
- Overs or sessions remaining
- Run rate
- Pitch conditions
- Batting depth
- Team strength
- Probability of a declaration
- Probability of a draw
Academic research has used multinomial models to estimate win, loss and draw probabilities in Test cricket using match-state variables such as lead, wickets, run rate, overs remaining, venue and team strength.
Does the Toss Affect Win Probability?
Yes, but the impact is not necessarily the same in every match.
The toss can influence whether a team bats or bowls first, while venue characteristics, pitch conditions and weather can affect the value of that decision.
A good model should therefore avoid treating the toss as an automatic advantage. Instead, it should estimate how the toss decision interacts with the specific venue and conditions.
Once the match begins, the current score and match state generally become much more important than the simple fact that a team won the toss.
Why Can a Team With 80% Win Probability Still Lose?
Because 80% is not 100%.
If a model gives Team A an 80% probability, Team B still has a 20% estimated chance.
Cricket is particularly suitable for probability-based analysis because a single event can have a major effect:
- A dropped catch
- A batting collapse
- A six in the final over
- A run-out
- A bowling spell
- An unexpected partnership
This is why win probability should be interpreted as a measure of current advantage, not a guaranteed prediction.
Is Win Probability the Same as Match Prediction?
Not exactly.
A traditional match prediction might say:
Team A is predicted to win.
Win probability gives more information:
Team A has a 64% estimated chance of winning, while Team B has a 36% chance.
The second approach communicates uncertainty.
It also makes it easier to understand how close a match really is. A 51–49 prediction is very different from a 90–10 prediction, even though both technically identify the same favourite.
What Factors Have the Biggest Impact?
The exact weighting depends on the model, but common variables include:
| Factor | Why It Matters |
| Current score | Shows how far the team has progressed |
| Target | Defines the remaining task |
| Balls remaining | Determines available scoring opportunities |
| Wickets remaining | Represents batting resources |
| Required run rate | Measures the difficulty of the chase |
| Team strength | Captures differences between teams |
| Batter strength | Helps estimate future scoring |
| Bowler strength | Helps estimate future wickets and runs |
| Venue | Captures ground-specific conditions |
| Toss | Can influence innings conditions |
| Weather | Can affect playing conditions and interruptions |
| Pitch | Influences batting and bowling difficulty |
Modern prediction systems can combine these variables rather than relying on one statistic alone.
A Simple Example of Live Win Probability
Imagine a T20 team is chasing 180.
After 10 overs:
Score: 90/2
Runs required: 90
Balls remaining: 60
Wickets remaining: 8
The team needs 9 runs per over.
A model might consider this a reasonably competitive position.
Now imagine two possible next overs.
Scenario A: 14 runs, no wicket
New position:
104/2 after 11 overs
The required rate falls and the batting team still has eight wickets in hand. Its win probability could increase.
Scenario B: 3 runs and two wickets
New position:
93/4 after 11 overs
The target has barely changed, but the team has lost two important resources. Its probability could fall substantially.
This illustrates why win probability is continuously recalculated rather than being based only on the score.
How Accurate Is Cricket Win Probability?
No prediction model can know the future with certainty.
Accuracy depends on:
- Quality of historical data
- Quality of player ratings
- Match format
- Feature selection
- Model design
- Calibration
- How unusual the match situation is
- Quality of live data
A strong model should therefore be evaluated not only on whether it correctly identifies the winner, but also on whether its probabilities are well calibrated.
For example, if a model gives teams a 70% probability in 100 comparable situations, roughly 70 of those teams should win over a sufficiently large sample.
How to Read “Today’s Match Win Probability”
When you see a live prediction such as:
India — 67%
Australia — 33%
the best interpretation is:
Based on the model’s available information, India currently has the stronger statistical position, but Australia still has a meaningful chance of winning.
The percentage should be treated as a snapshot. It can change dramatically as the match develops.
Frequently Asked Questions
What is win probability in cricket?
Win probability is the estimated chance that a team will win a cricket match from a particular match situation.
How is cricket win probability calculated?
It can be calculated using statistical or machine-learning models that combine historical results with current match information such as score, wickets, balls remaining, required run rate, team strength, players and venue.
Does win probability predict the winner?
It provides a probability rather than a guarantee. A team with a 70% probability can still lose.
Why does win probability change after every ball?
Each delivery changes the match state. Runs, wickets, dot balls and other events alter the remaining task and available resources.
Are cricket win probability models the same everywhere?
No. Different providers use different datasets, variables, algorithms and simulation methods.
Is win probability useful for today’s cricket match?
Yes. It provides a data-driven way to understand the current balance of a match, especially when combined with live score, wickets, required run rate and balls remaining.
Final Thoughts
Cricket win probability turns a complicated live match into an understandable statistical estimate.
The calculation can range from relatively simple historical models to sophisticated simulations that evaluate thousands of possible match outcomes. The most useful models consider much more than the scoreboard: wickets, balls remaining, required run rate, player quality, team strength, venue and match conditions can all influence the result. For readers researching the best online cricket ID provider in India, understanding these factors can also help them better interpret cricket match statistics, live predictions and win-probability figures.
Most importantly, win probability is not a promise about who will win. It is a measurement of how likely each outcome appears based on the information available at that moment.
That is what makes live cricket probability so useful: it shows not just who is ahead, but how strongly the numbers believe they are ahead.
